
Fewer Mortgage Loan Officers in 2027: Who Gets the Volume?
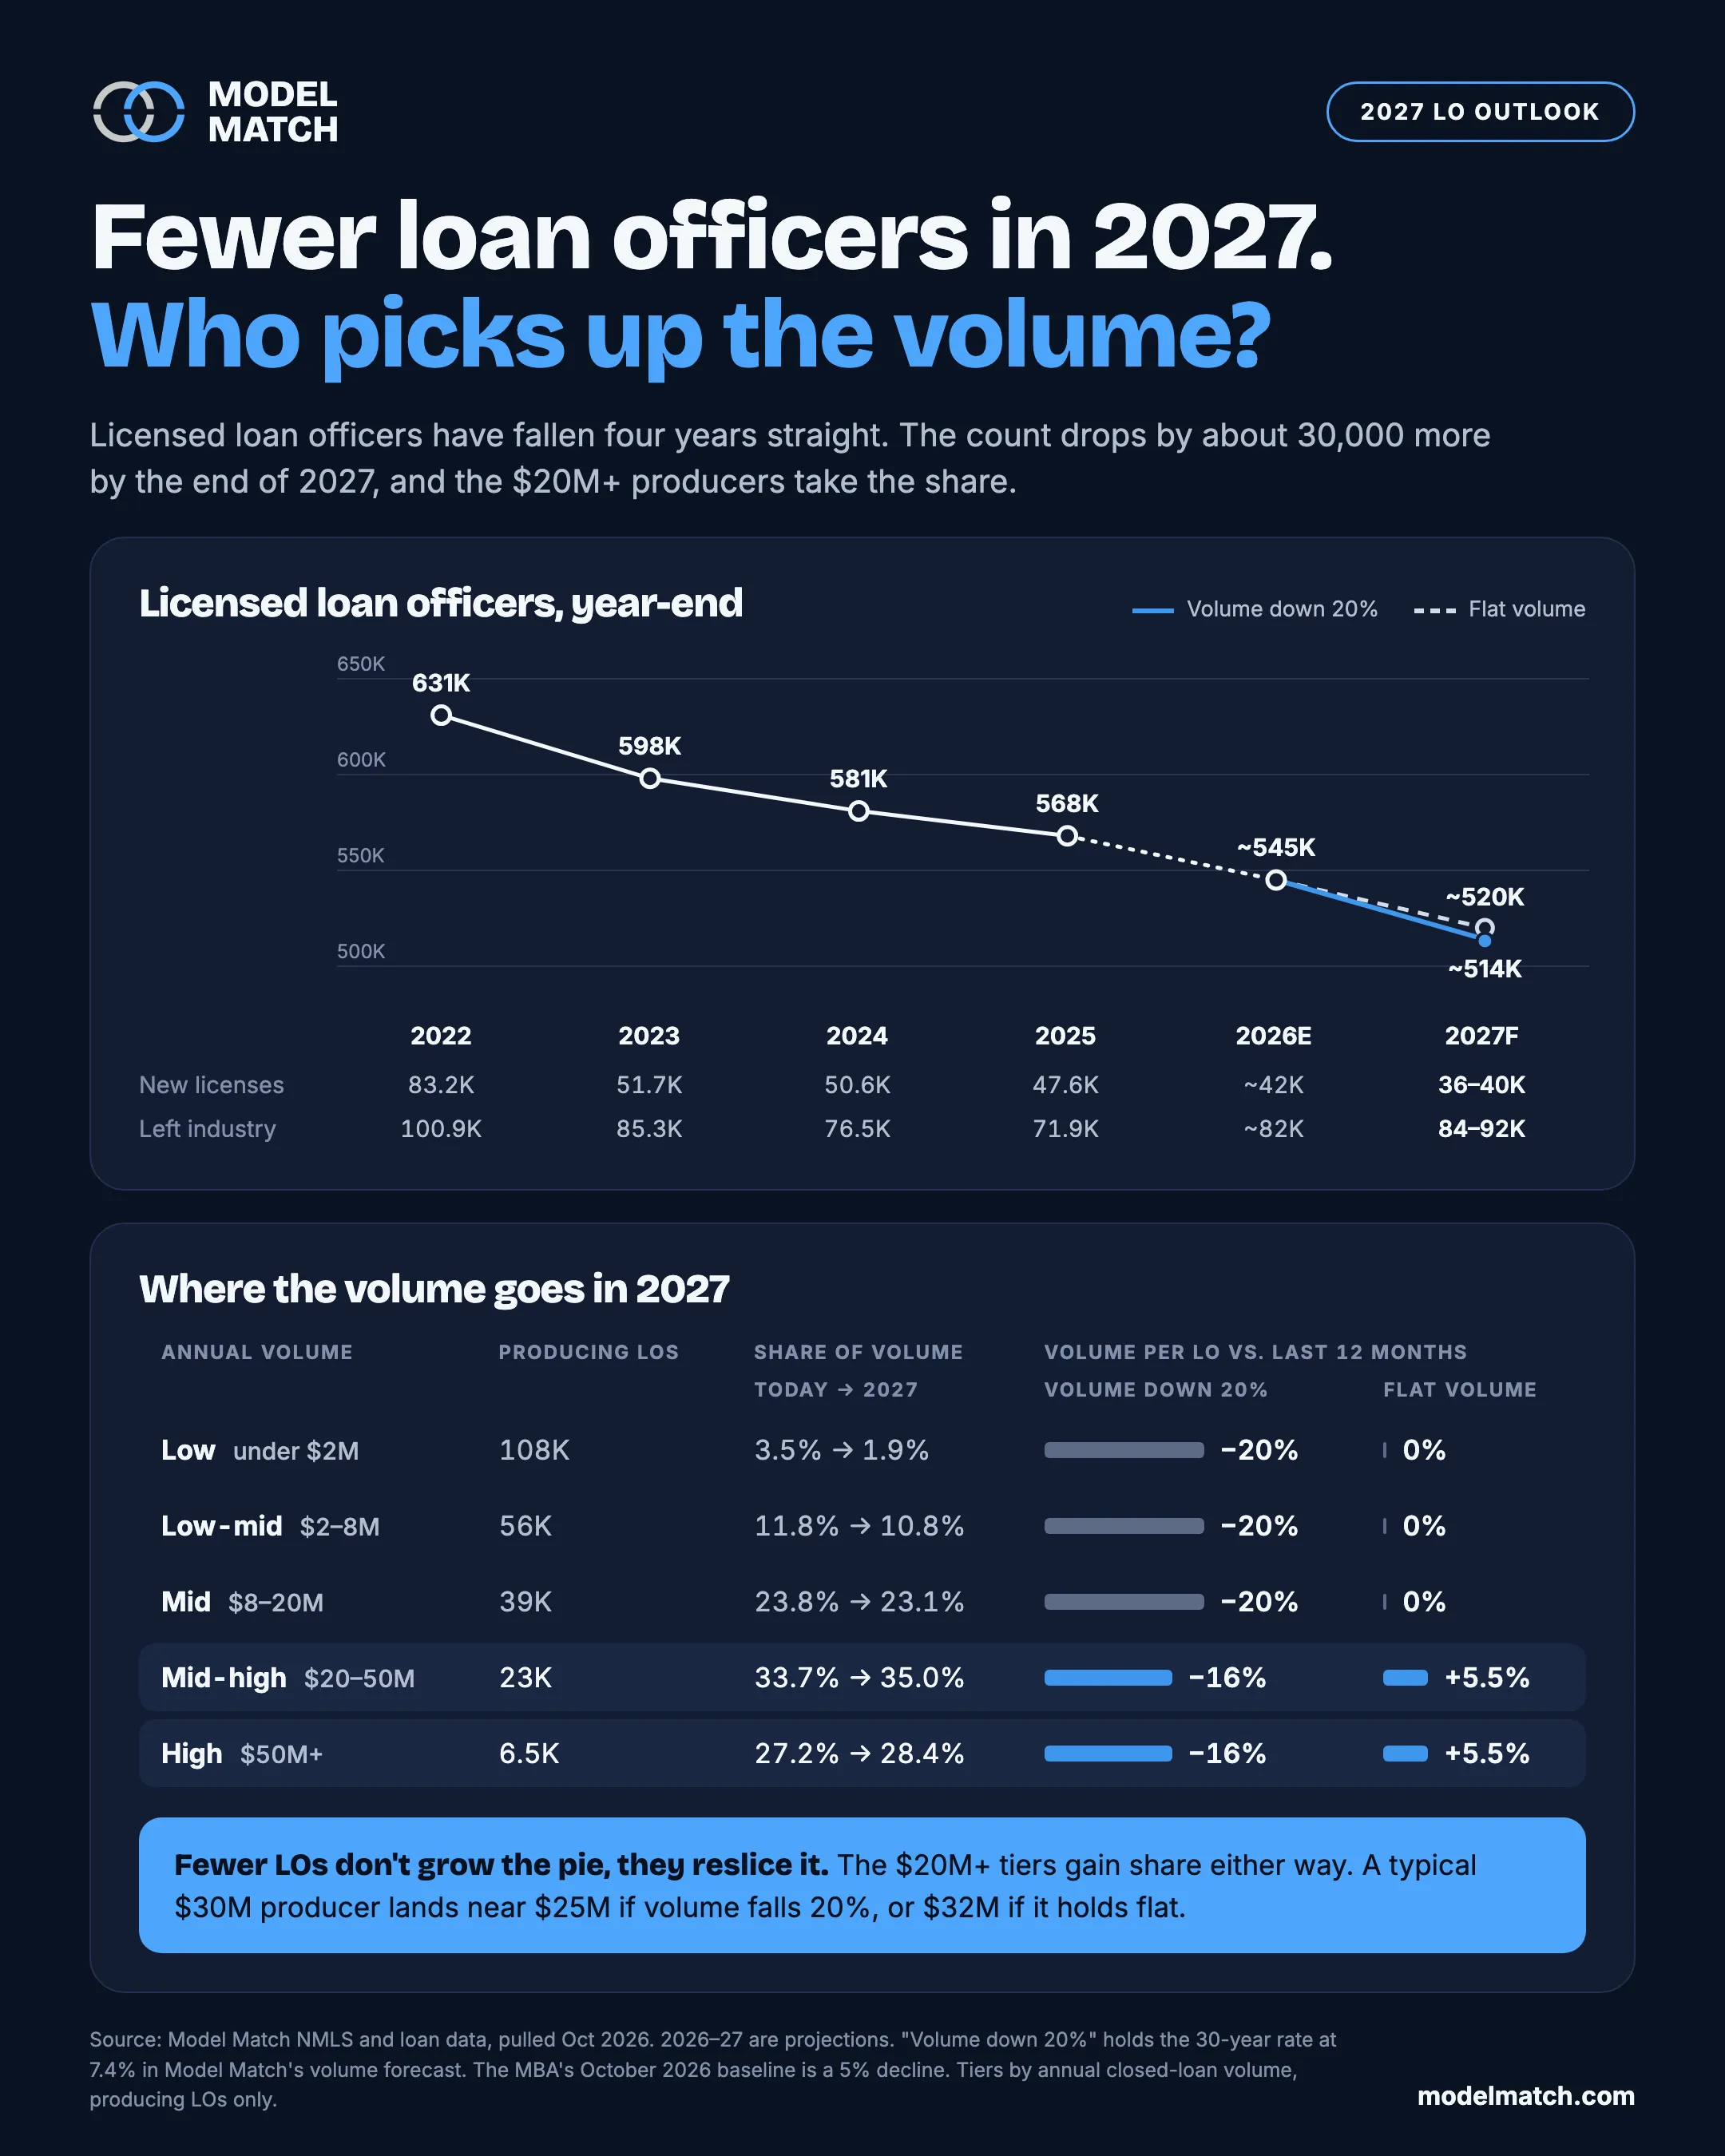
Mortgage loan officer licenses have fallen four years straight. Model Match NMLS data projects 30,000 fewer by the end of 2027 and shows who gets the volume.
The number of licensed mortgage loan officers has fallen four years in a row, from 651,000 at the start of 2022 to about 550,000 today, and Model Match NMLS data projects the count will drop by roughly another 30,000 by the end of 2027. The volume those loan officers leave behind doesn’t spread evenly across everyone who stays. In our projection, it moves to the loan officers already closing $20 million or more a year.
There has been a lot of talk lately about the difference between a “mortgage advisor” and a loan originator. The licensing and production data offers one way to answer it, and it starts with a simpler question: when the loan officer count drops, who picks up the volume?
Mortgage loan officer licenses: four years of decline
We pulled year-end counts of actively licensed loan officers from NMLS records, along with how many were newly licensed and how many left the industry each year.
| Year | Licensed LOs, year-end | New licenses | Left the industry |
|---|---|---|---|
| 2022 | 631K | 83.2K | 100.9K |
| 2023 | 598K | 51.7K | 85.3K |
| 2024 | 581K | 50.6K | 76.5K |
| 2025 | 568K | 47.6K | 71.9K |
| 2026 (estimate) | ~545K | ~42K | ~82K |
| 2027 (projection) | 514K–520K | 36K–40K | 84K–92K |
Source: Model Match NMLS data, pulled October 2026. 2026 and 2027 are projections.
Licensed mortgage loan officers, year-end
- 2022 631 K
- 2023 598 K
- 2024 581 K
- 2025 568 K
- 2026 (est.) 545 K
- 2027 (proj.) 514 K If volume falls 20%. About 520K if volume holds flat.
Three things stand out:
- The entry pipeline has been nearly cut in half. New licenses fell from 83,200 in 2022 to 47,600 in 2025, and the trailing 12 months sit at about 43,100. The 2027 projection is 36,000 to 40,000.
- Exits are picking back up. Departures eased from 100,900 in 2022 to 71,900 in 2025. In the 12 months ending September 2026 they were back to about 80,700, nearly two exits for every new license.
- The decline is cumulative. The industry is already about 81,000 loan officers smaller than it was at the end of 2022, a 13% drop. Reaching 514,000 would make it more than 18%.
Fewer than half of licensed loan officers show closed loans
A license count overstates how many people are competing for a borrower. In the last 12 months, about 232,000 loan officers had recorded closed-loan volume in Model Match, roughly 42% of the 550,000 who hold an active license.
Among the loan officers who are producing, volume is heavily concentrated:
| Annual volume tier | Producing LOs | Share of producing LOs | Share of volume today |
|---|---|---|---|
| Under $2M | 108,145 | 47% | 3.5% |
| $2M–$8M | 55,577 | 24% | 11.8% |
| $8M–$20M | 38,553 | 17% | 23.8% |
| $20M–$50M | 22,843 | 10% | 33.7% |
| $50M+ | 6,528 | 3% | 27.2% |
Loan officers with recorded closed-loan volume in the 12 months ending September 2026, by annual volume. Source: Model Match loan and NMLS data.
Producing loan officers by annual volume tier (thousands)
- Under $2M 108.1 K
- $2M–$8M 55.6 K
- $8M–$20M 38.6 K
- $20M–$50M 22.8 K
- $50M+ 6.5 K 3% of producers, 27% of volume.
About 29,400 loan officers close $20 million or more a year. That’s 13% of producing loan officers and roughly 5% of everyone with a license, and they hold 61% of the volume. Nearly half of producing loan officers close under $2 million a year and together account for 3.5%.
See where any loan officer sits
Look up closed-loan volume, units, and loan mix for a loan officer by name or NMLS ID.
Where loan volume goes in 2027
We modeled volume per loan officer in 2027 against the last 12 months under two market scenarios:
- Volume down 20%. Model Match’s volume forecast with the 30-year rate held at 7.4%, which puts total origination volume about 20% lower.
- Flat volume. Total origination volume level with 2026.
| Annual volume tier | Share of volume: today → 2027 | Volume per LO, volume down 20% | Volume per LO, flat volume |
|---|---|---|---|
| Under $2M | 3.5% → 1.9% | −20% | 0% |
| $2M–$8M | 11.8% → 10.8% | −20% | 0% |
| $8M–$20M | 23.8% → 23.1% | −20% | 0% |
| $20M–$50M | 33.7% → 35.0% | −16% | +5.5% |
| $50M+ | 27.2% → 28.4% | −16% | +5.5% |
2027 figures are projections. Volume per LO compares 2027 with the 12 months ending September 2026, producing loan officers only. Source: Model Match NMLS and loan data.
The loan officers closing $20 million or more gain share in both scenarios, from about 61% of volume today to about 63% in 2027. What changes is whether that share is worth more or less in dollars:
- If volume holds flat, the top two tiers each pick up about 5.5% more volume per loan officer while everyone else stays level. A $30 million producer lands near $32 million without changing anything.
- If volume falls 20%, volume per loan officer falls in every tier. The top tiers give up about 16% and the rest give up about 20%, which puts the same $30 million producer near $25 million.
A shrinking headcount is not a raise for the loan officers who stay. In a down market the top tiers still lose volume. They lose less of it than everyone else, and that gap is where the share gain comes from.
The MBA’s October forecast lands between the two scenarios
On October 11, the Mortgage Bankers Association released a new baseline at its annual convention: 30-year rates above 7% through 2027, total originations down 5% to just under $2 trillion, refinance volume down 17%, and loan count falling from 5.3 million to 5.0 million. That sits between the two scenarios above, closer to flat, so the two columns are best read as a bracket around it.
Set that loan count against the license count: about 5 million loans across roughly 515,000 licensed loan officers is fewer than 10 loans per license for the year.
Are the “advisors” the ones gaining share?
The mortgage advisor versus loan originator conversation is mostly about positioning. There is one license, and a title doesn’t change it. The argument, made in pieces like this Inman interview, is that the originators who last will be advisors who put relationships and strategy ahead of the transaction.
The production data can’t see a title, but it can see what an advisory business looks like from the outside: volume that holds up when refinances disappear. With the MBA projecting refinance volume down 17% and purchase volume up less than 1%, 2027 volume comes from purchase business and repeat clients, which means agent relationships and a past-client database. It is hard to close $20 million a year with rates above 7% without both, and that is the group the projection favors.
Two cautions before reading this as “the top 13% win”:
- Share is not guaranteed to any individual. These are tier averages. A $12 million producer with a strong referral base can out-earn the projection, and a $40 million producer dependent on one builder or one refinance channel can fall out of the tier.
- Share gains go to producers who stay put. Our analysis of loan officer production data on company switches found that loan officers closing 25 or more units a year lost 40% to 55% of their production in the months after a move. A top producer who changes companies in 2027 may hand the share gain to someone else.
What to watch next: the renewal window
NMLS licenses renew between November 1 and December 31, and exits cluster around that deadline. Last cycle, December 2025 and January 2026 accounted for about 18,600 exits, 23% of the trailing 12-month total. January alone was nearly 11,000, the highest month of the year.
The 2027 renewal window opens with 30-year rates above 7%. A loan officer who closed a handful of loans this year has to decide whether to pay for another year of licensing and continuing education. How many don’t renew will be the first real read on whether 2027 tracks the 514,000 or the 520,000 path, and it will show up in the data by February.
What this means for your 2027 plan
If you run a mortgage company or a branch:
- Plan on tiers, not headcount. A roster of 40 loan officers where six close $20 million or more is a different business than one where two do. Know which you have before you set a 2027 volume goal.
- Protect the producers who hold the share. In both scenarios the $20 million tiers end the year with more of the market. Losing one is the most expensive departure on your roster, and the data says it usually costs them too.
- Decide what the under-$2 million tier is for. It is nearly half of producing loan officers and 3.5% of volume, projected to fall below 2%. Some of those loan officers are on their way up. Budget coaching and leads for the ones who are, and be honest about licensing and overhead costs for the ones who aren’t.
- Size your market, not just the national number. A 5% national decline will not be 5% in every county. Run a mortgage market forecast for your footprint under both rate paths.
If you’re a loan officer:
- Know your tier and the next one up. The line that matters in this data is $20 million. If you’re at $14 million, the difference between holding share and gaining it is one to two more closings a month.
- Build for purchase and repeat business. That is where 2027 volume is. Find the real estate agents closing in your market and look at who they already send loans to.
- Watch who leaves your market. A producing loan officer who doesn’t renew leaves agent relationships and past clients without a lender. Market Insights shows loan officer production and movement by company, city, and ZIP code, so you can see where that opens up.
How we built this
- Source: NMLS licensing records for loan officer counts, new licenses, and industry exits, matched to recorded closed-loan production for the tier analysis. Pulled October 2026.
- Historical figures: 2022 through 2025 are year-end counts. Trailing 12-month figures cover October 2025 through September 2026.
- Projections: 2026 is an estimate based on the year to date. 2027 is a projection under two scenarios: origination volume down about 20%, from Model Match’s volume forecast with the 30-year rate held at 7.4%, and origination volume level with 2026. The MBA’s October 2026 baseline, a 5% decline, falls between them.
- Tiers: set by each loan officer’s closed-loan volume over 12 months. Only loan officers with recorded volume are included, which is why the tier counts are smaller than the licensed count.
- Limits: recorded production comes from public loan records and is robust, not exhaustive. Projections are scenario estimates. They describe a tier on average and will move as rates and renewal data come in.
Know where the volume is going before it moves
Start a 14-day free trial and track mortgage loan officer production, licensing changes, and market activity by name, company, and ZIP code.
By signing up, you agree to our Terms of Use & Privacy Policy
FAQs
How many licensed mortgage loan officers are there in 2026? Model Match NMLS data shows about 550,000 actively licensed mortgage loan officers at the end of September 2026, down from 631,000 at the end of 2022. The count has fallen every year since, and it is on pace to finish 2026 near 545,000.
How many loan officers are leaving the mortgage industry? In the 12 months ending September 2026, about 80,700 loan officers exited the industry while about 43,100 were newly licensed, which is nearly two exits for every new license. Annual exits have run between 72,000 and 101,000 every year since 2022.
How many loan officers will there be in 2027? Model Match projects between 514,000 and 520,000 licensed loan officers at the end of 2027. The low end assumes origination volume falls about 20%, and the high end assumes it holds flat. Both are projections, not reported figures.
When loan officers leave the industry, who picks up their volume? Mostly the loan officers already closing $20 million or more a year. That group is about 13% of producing loan officers and holds about 61% of closed-loan volume today. Model Match projects its share rises to about 63% in 2027, whether origination volume holds flat or falls 20%.
Does a smaller loan officer count mean more volume per loan officer? Only if the market holds up. In a flat market, loan officers closing $20 million or more gain about 5.5% in volume each while lower tiers stay level. If volume falls 20%, volume per loan officer falls in every tier, by about 16% for the top tiers and about 20% for everyone else. Fewer loan officers changes how volume is split, not how much there is.
What is the difference between a mortgage advisor and a loan originator? There is no licensing difference. Mortgage loan originator is the licensed role, and mortgage advisor is a positioning term for originators who run a relationship-led business instead of a transactional one. Production data can't see a title. It shows that the loan officers projected to gain market share are the ones already closing $20 million or more a year.